5.3. Exploring the data with a spreadsheet
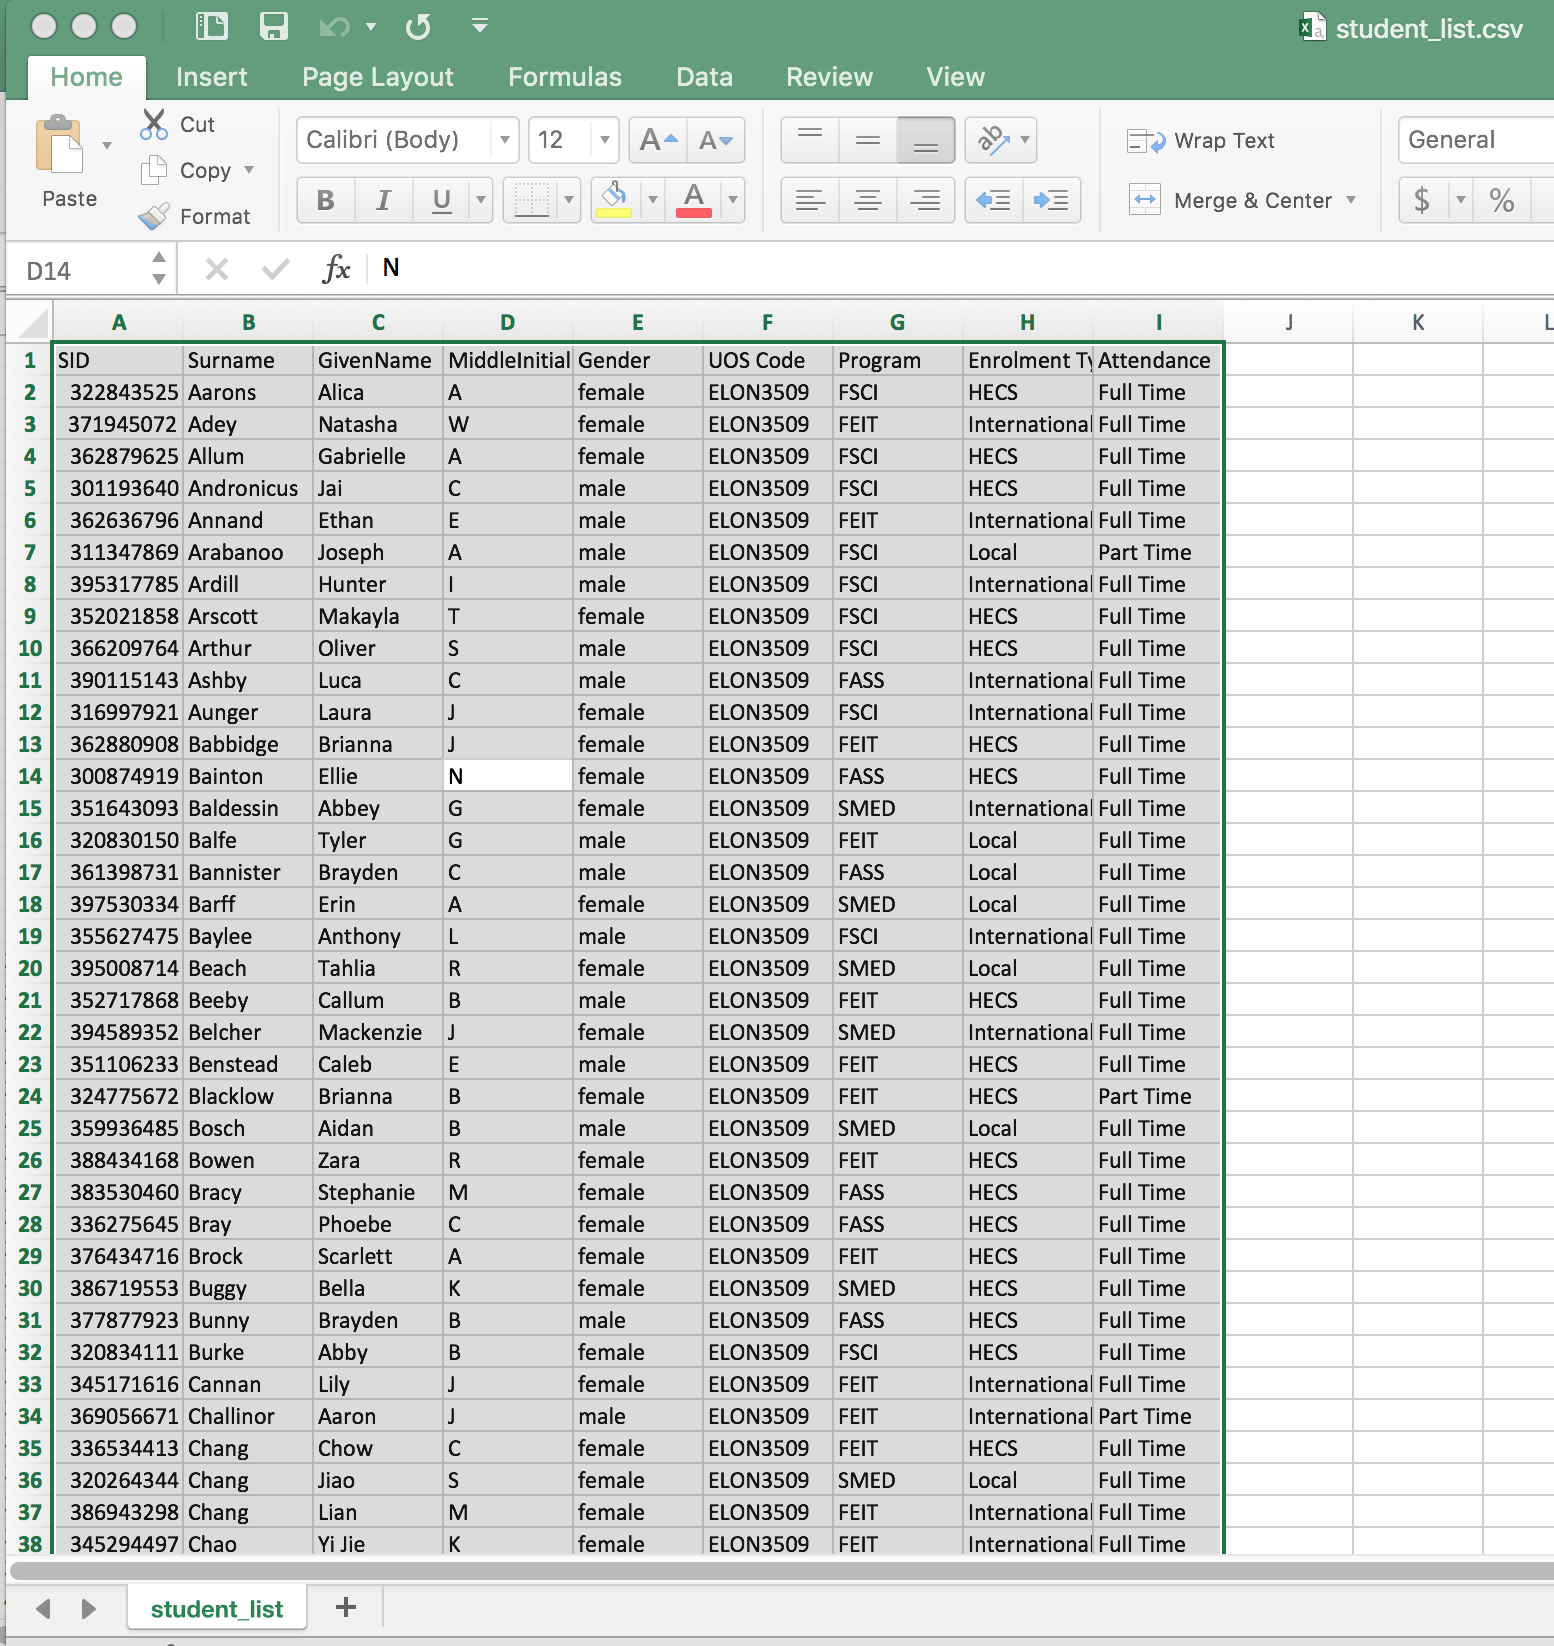
Open the file student_list.csv with a recent version of Excel. Select all the data in the spreadsheet (you can use Crtl-A or Cmd-A in OSX) as shown in the following figure:
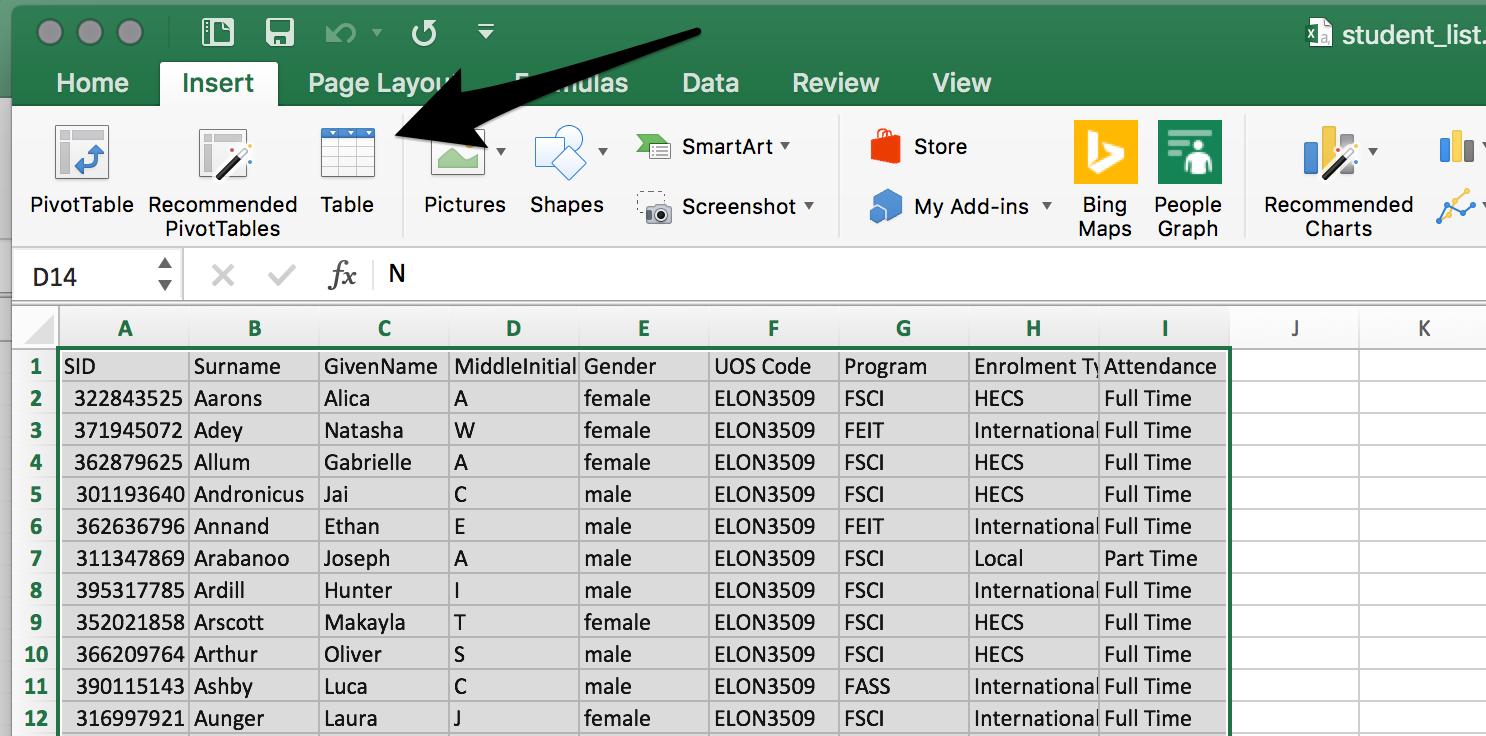
Next click on the menu item Insert and then click on the Table icon as shown in the following figure.
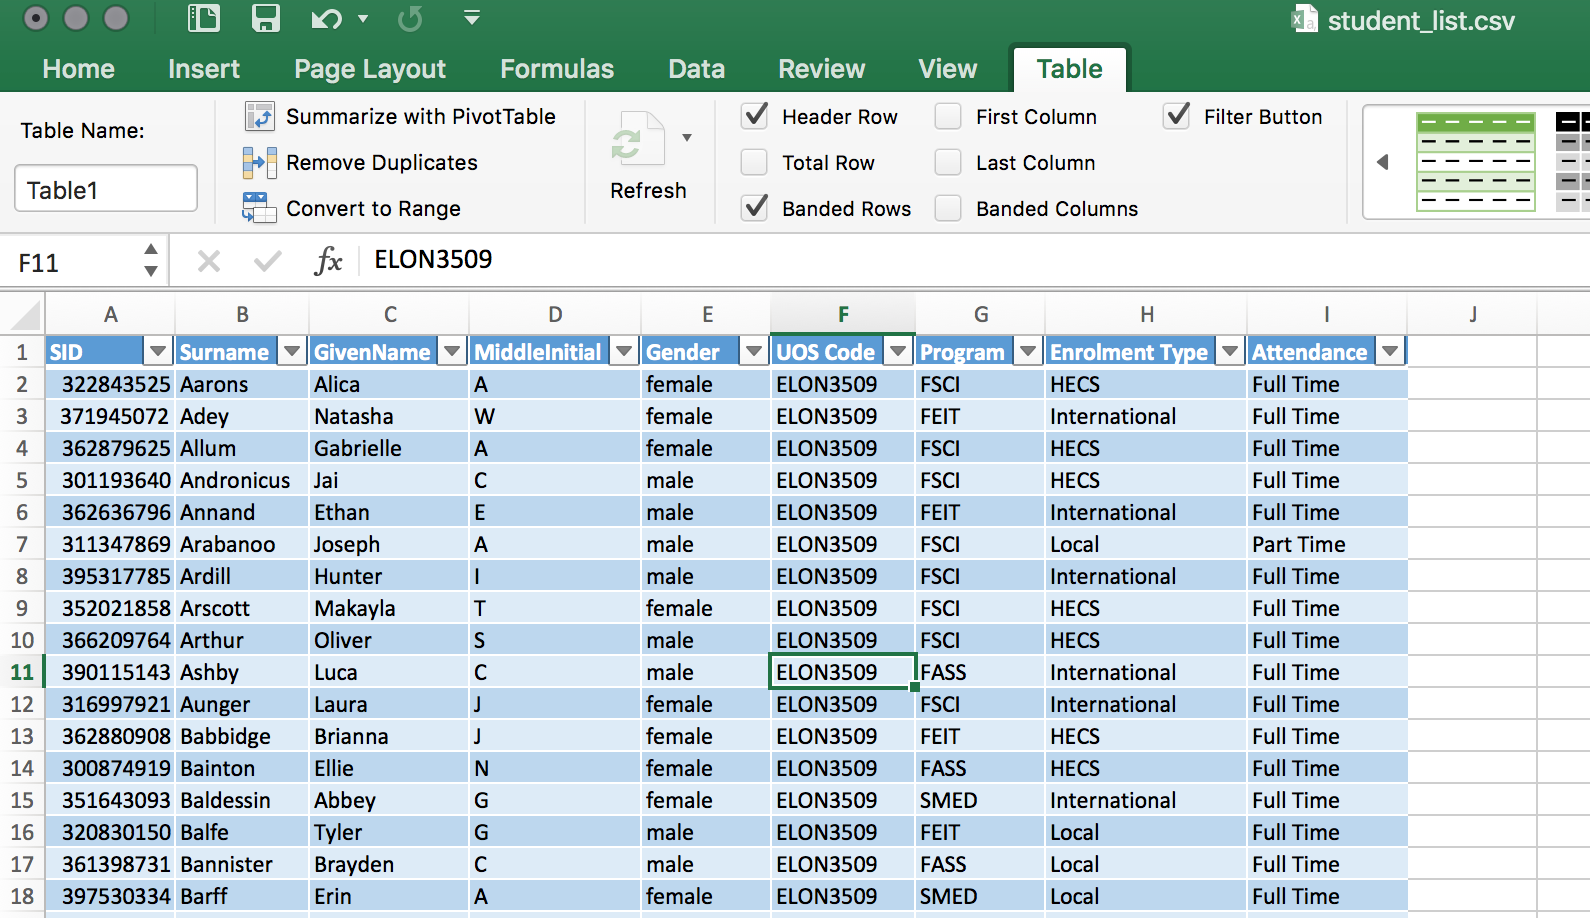
If you see a dialog showing you the range just selected and stating that the table has headers, just confirm the creation by clicking OK. You should now see the data in the spreadsheet with some coloring and a few icons in the cells at the top row as shown in the following figure.
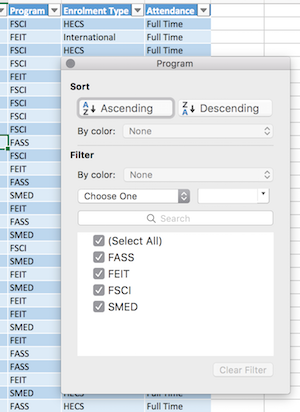
The cells in the top row are the names of the columns contained in the file. If you click on the triangle at the right of any cell you will see a menu as shown in the following figure:

The menu allows you to sort the rows according to the value in the column (the buttons Ascending and Descending) and filter or select some of the rows to be viewed. In the example, the column contains four values that you can select individually. Click in the bottom part of the window to select/discard values and verify that the content of the table changes (only a subset of rows is shown). You may view all rows by choosing the item (Select All). Repeat this procedure with the columns with names Program, Enrolment Type, Attendance, Gender and Course Code. Once you select a value with the filter, type Crtl-up (CMD-up in OSX) to move to the top of the table. Hold the Shift key and press Crtl-down (Cmd-down in OSX) and the entire row should be selected. At the bottom of the Excel screen you will see the number of elements selected as a quick way to know the number of rows. Repeat the previous procedure and find out how many students are local, HECS or international.
5.3.1. Questions
How many students are in your class?
How many programs do you have in the data? What is the break out of the students per program?
What type of enrollment do you have? What is the percentage of students for each value?
What is the gender balance in the course?


