3.3. Table
“You’re here because you know something. What you know you can’t explain, but you feel it” – Morpheus, The Matrix
The information stored in the workflow table is accessed through the Table link in the top bar menu selecting the option Full view. As this table can be arbitrarily large, the application groups the rows into pages and provides links to each of the pages at the bottom of the table. The top of the table includes a pull down menu to choose how many rows are shown per page. If the table has a large number of columns, a horizontal scroll is available to show the additional content. The order of the columns in the table can be changed by dragging them from the top row and dropping them in a new position.
The following figure shows an example of the main table page.
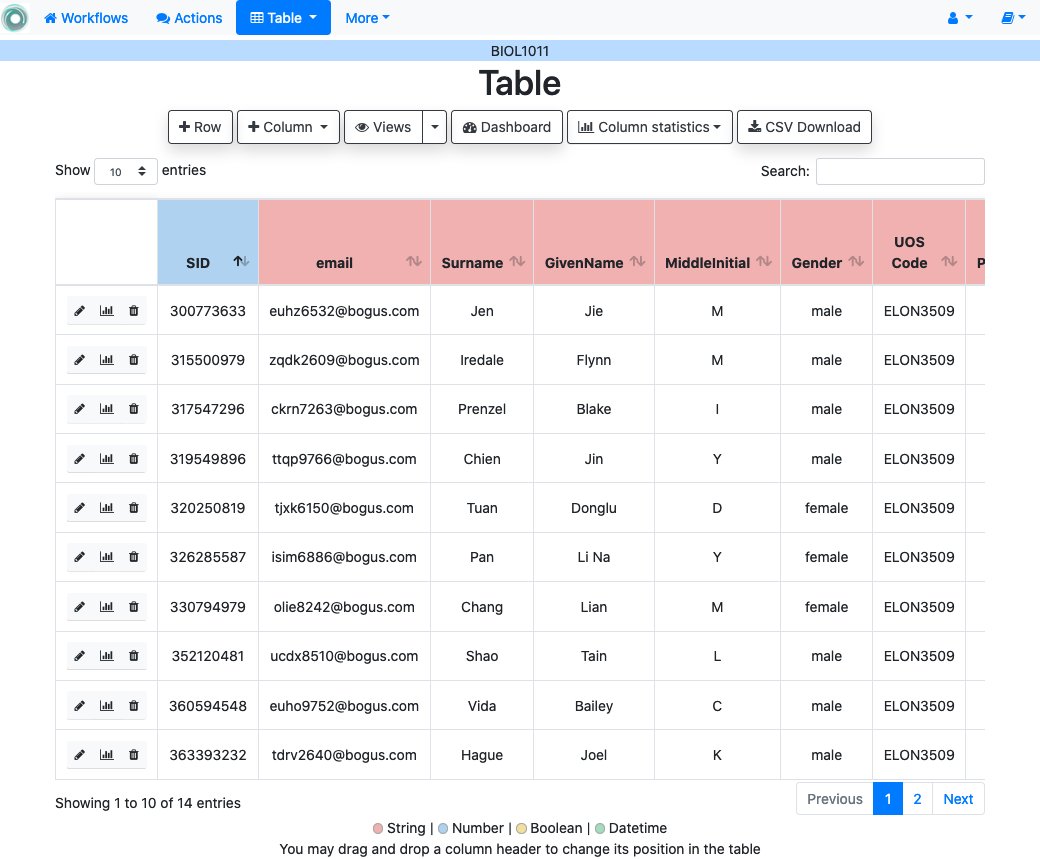
The table also offers the possibility of searching for a value. The given string is used to search all the columns in the table.

The buttons at the top of the page offer the following functions:
- Row
A form to introduce a new row in the table with one field per column.
- Column
Add a new column to the table. The pull-down menu also allows to add a column with values calculated with a formula and using the existing values, or a column with random values.
- Views
A view is a screen showing a subset of rows and/or columns in the table. Clicking in the Views link will take you to another screen to manage these views. The pull down menu offers links to access the subset of the table defined by the available views.
- Dashboard
The dashboard shows a statistical summary for the columns shown in the table. This number may be too high, so you should consider using table views to reduce the amount of information shown in the dashboard.
- Column statistics
This button allows to choose a non-key column and show an statistic summary of its values
- CSV Download
This functionality downloads the data in the table as a CSV file. Combine this functionality with the table views to handle large tables.
The left-most column in the table shows the operations to manipulate a row:
- Edit content
This link opens a form with one field per column to modify the values in the row. The key columns are shown but not allowed to be changed.
- Dashboard
A dashboard showing the population measures for all the columns and a mark showing where are the values for this row.
- Delete
Delete the row from the table.
3.3.1. Table Views
Due to the potentially large size of the workflow table in either number of rows or columns, OnTask offers the possibility to define Views. A view is a subset of columns and rows of the original table. You may define as many views as needed. The link Views in the main table page shows the views available and the operations to manage them.
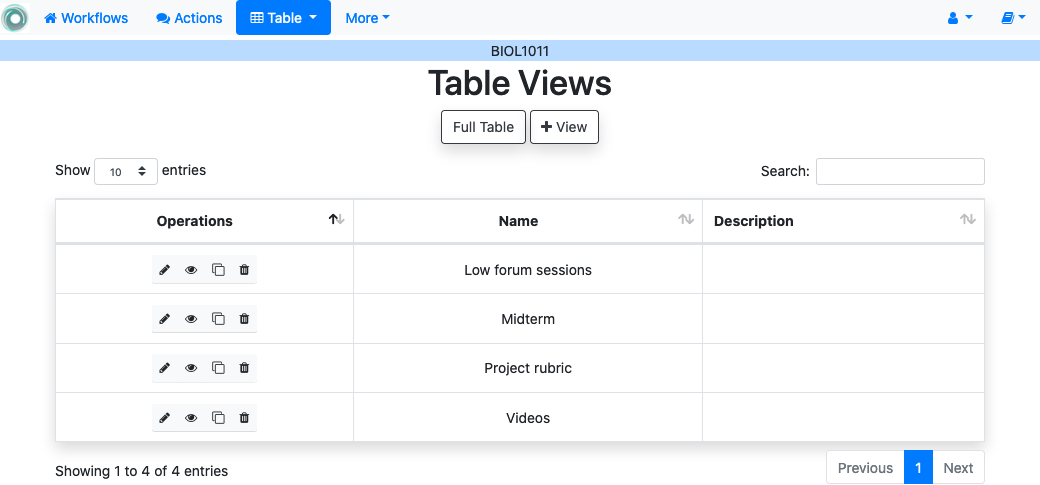
The buttons at the top of the page offer the following operations:
- Full Table
Go back to the page showing the entire data table.
- View
Create a new view
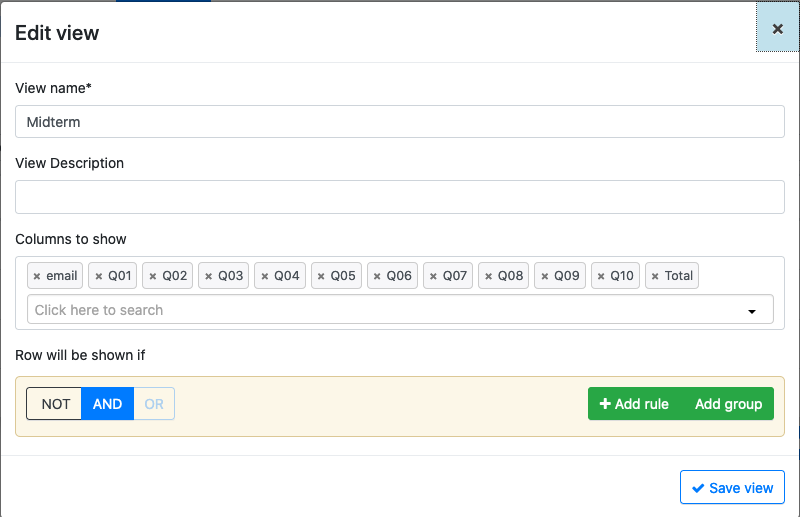
When creating a view you need to provide a name (required), a description, a subset of columns to show (at least one of them must be a key column), and an expression to select a subset of rows. This expression is evaluated with the values of every row and if the result is True, the row is included in the view. The following figure shows an example of the information that is included in the definition of a view.
Once a view is created, the following operations are available:
- Edit
Edit the elements in the view (name, description, set of columns to show and row filter)
- Show
Show the subset of the table selected by the view
- Clone
Create a duplicate of this view with the prefix Copy_of added to its name. This operation is useful to create a new view with content that is similar to an already existing one (clone and edit).
- Delete
Delete the view.
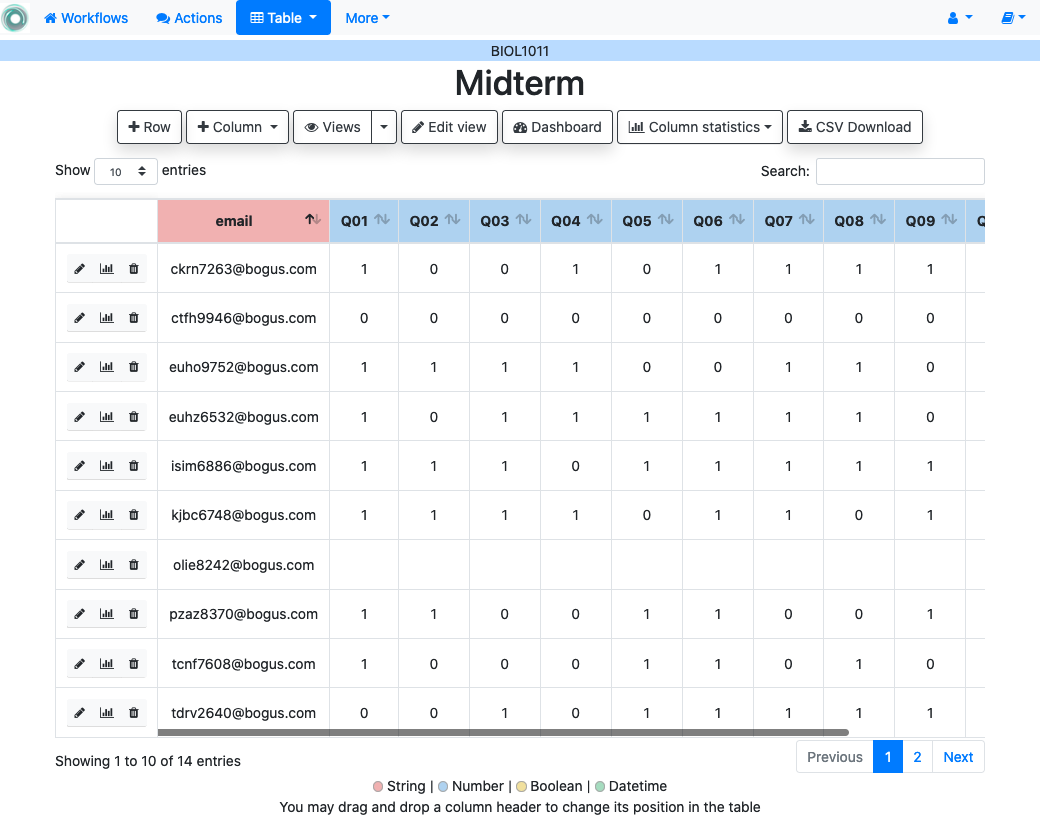
The page to show the subset of the table defined by the view is identical to the full table view, but the table is restricted to the appropriate columns and rows. The view shown in the previous figure defines a subset of 12 columns of the table that is rendered as shown in the following figure.
The Dashboard and CSV Download buttons, when used while in a view, will apply to the selected data subset.
